


New article
Recently updated
Design and Layout of a Report Using the Design Wizard

You must first have created a data query.
Select the [Design] tab in order to begin laying out the report.
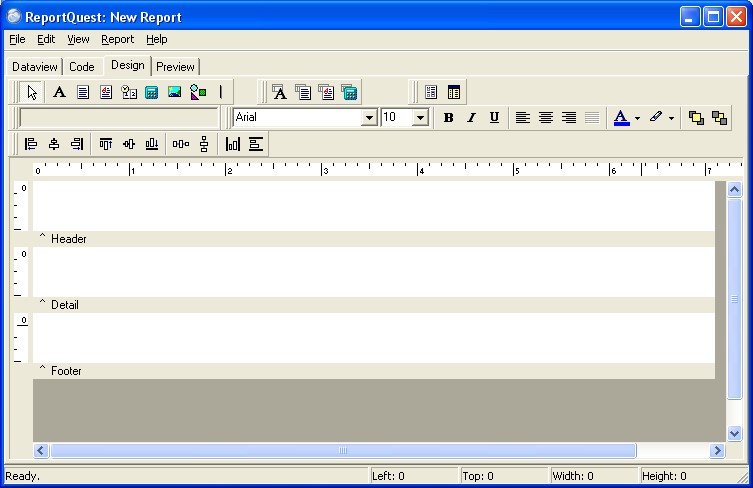
Using the Design Wizard
There is a simple way of getting the basic design for your reports.
Once you have built the Query, you will be taken to the design page.
From the [File] menu, select [New] and you will be presented with a selection of ways to build your report.
Select the [Report Wizard].
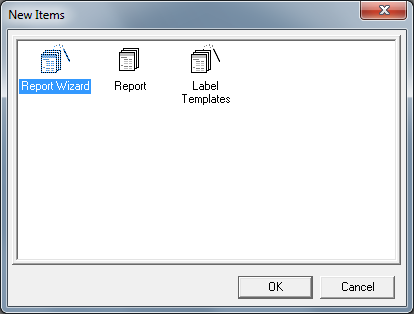
Select OK
From the Available Fields list of fields, select those fields you wish to appear in your report, by highlighting them from the left column and moving then to the right column.
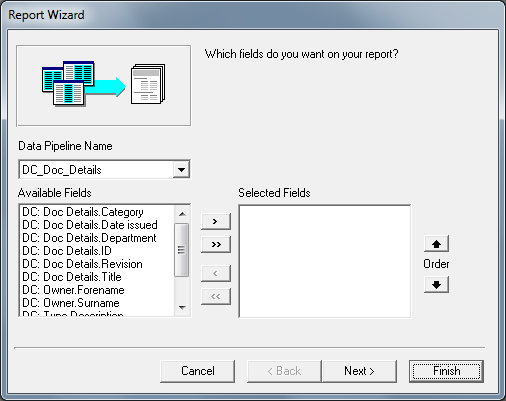
Determine in which order you want them to be listed in the report using the up and down arrows.
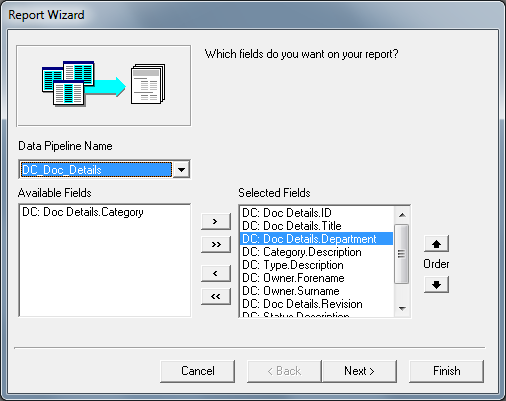
Select [Next]
From the Available Fields on the left, select the field by which the report results should be grouped, for instance, group the results by the department field.
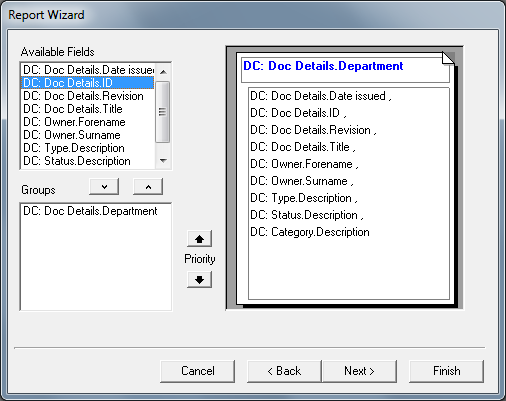
Select [Next].
The next step will allow the page orientation to be defined, and the form of the report layout.
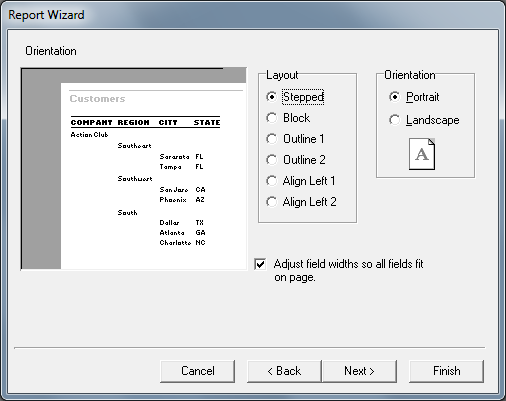
Select [Next].
There are a number of pre-defined Styles available to use. Select the one most suitable for the report.
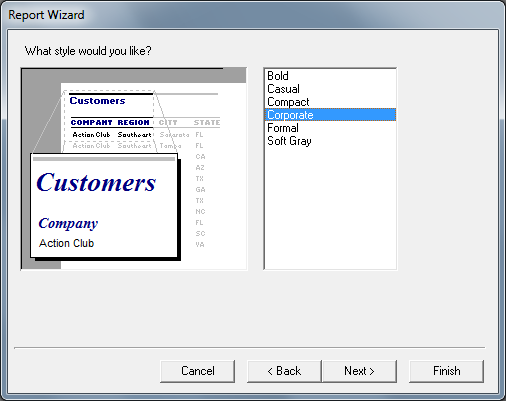
Select [Next].
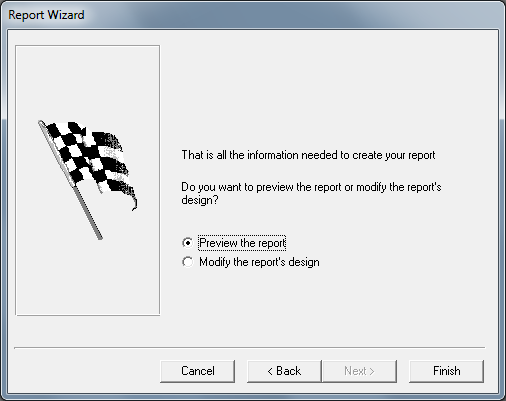
The report can be previewed as it is or the option to modify the report design is available where changes to the layout or wording can be made.
Once the report style is defined, and you are happy with your report, then select [Finish].
The Report Wizard puts in the labels for the report using the field name chosen when the query was designed.
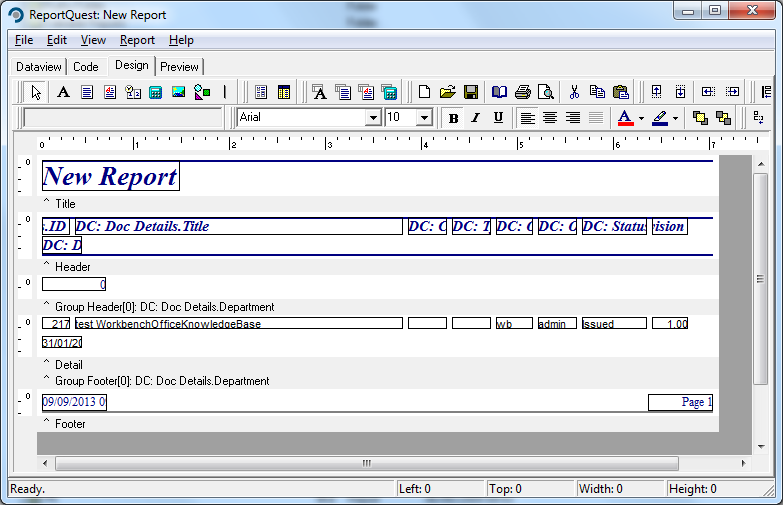
The Report Wizard puts in the labels for the report using the field name chosen when the query was designed.
These will probably not be the labels required for the report.
If the labels need to be changed, see the element “Setting the Label Names” for the report